- brian.finance
- Posts
- Root Insurance: The Embedded Car Insurtech - Deep Dive Stock of the Month
Root Insurance: The Embedded Car Insurtech - Deep Dive Stock of the Month
Can Root's hyper-efficient partnership model create a dominant moat in the auto insurance industry?

With a string of profitable quarters, the core question for Root investors is no longer if the business model works, but how fast it can scale. This analysis breaks down the key metrics driving that growth. By the end of this article you will have knowledge of:
Root Basic Insights
Current benchmarks such as profitability & combined ratio
Breakdown of current cost structure on both a marginal and fixed basis
How they fare vs the competition for loss ratios
Root Advanced insights
The level of churn both present and historically for Root
How many customers are coming from Partner Channel every quarter vs Direct Channel
Marketing efficiency and cost of Direct Channel growth
Insights into potential of future growth & profitability
A Note on Advanced Metrics: Some advanced metrics in this article, such as churn, are my own calculations from data reported by Root. While they provide a strong directional understanding, they are not exact figures and may contain a margin of error.
If you already have a strong fundamental understanding of Root, you may skip ahead to the Insights section.
Root Insurance Introductory Overview
Root is an insurance company that is almost entirely focused on selling car insurance in the United States.
Root has 3 main pillars upon which it is built:
Create the best Point of Sale Embedded and optionally white label insurance experience for both end customers and the POS vendor (such as Carvana)
Have the best risk to rate pricing through strong focus on data science in telematics
Deliver and distribute the process and user experience primarily through their modern mobile app
Watch: Root CEO Alex Timm overviews the company from founding and their value proposition
The below interview explains the history of Root and their unique value add to the insurance industry.
Root Insurance Bear vs Bull Cases: Analyzing Both Sides of the Argument
Bull vs Bear - Risk Segmentation Through Telematics
The central pillar of the Root bull case is that its proprietary telematics technology and data science allow for risk segmentation superior to that of legacy insurers.
The Bull Case: Telematics
Bulls argue that Root’s ability to analyze smartphone data is fundamentally more predictive than traditional metrics. This technological edge, bulls claim, is responsible for Root's industry-leading loss ratios.
Evidence:
Root’s recent underwriting performance has been exceptional. In Q2 2025, the company reported a Gross Loss Ratio of 58% (Source: Root Q2 2025 Shareholder Letter, Page 5).
This continues a trend of strong performance, following a Full Year 2024 Gross Loss Ratio of 58.9% (Source: Root Q4 2024 Shareholder Letter).
Management attributes this to continuous improvement; in Q2 2025, Root released an updated pricing model, noting it "increases predictive power through better risk segmentation, including new rating variables and enhanced telematics features." (Source: Root Q2 2025 Shareholder Letter, Page 5).
The Bear Case: Competitors are Doing Telematics & Inflation Volatility
Bears argue that the technological advantage is transient and that Root's models have failed under inflation. Incumbents are heavily invested in Usage-Based Insurance (UBI) and possess vastly larger datasets and financial resources.
Evidence:
Competitive Catch-Up: Progressive, the industry's technology leader, has utilized UBI for decades. Progressive CEO Tricia Griffith has stated that UBI is their "most predictive rating variable" and highlighted their move to continuous monitoring, which began rollout in 2022. (Source: Carrier Management, March 2023).
Historical Failures: Root’s technology did not prevent poor performance during the inflationary spike. For the full year 2021, the gross loss and LAE ratio was 96.5%. In Q4 2021, the Gross Accident Period Loss Ratio hit 94% (Source: Root Q4 2022 Shareholder Letter, Page 3). This volatility forced Root to implement 53 rate filings with an average increase of 37% in 2022 to stabilize the business (Source: Root Q4 2022 Shareholder Letter). However, it is important to note that this pricing disadvantage resulted from unprecedented inflation, which also strongly affected larger competitors, rather than from a failure to separate risk among individual customers
Bull vs Bear - Distribution Strategy Advantage
Root utilizes a dual distribution model: Direct-to-Consumer (DTC) via mobile app and embedded partnerships/independent agents.
The Bull Case: Low-Cost Acquisition via Embedded Channels
Bulls highlight the efficiency of embedded insurance. Integrating the insurance quote directly into the car-buying process or via independent agent platforms drastically lowers Customer Acquisition Costs (CAC) compared to the expensive advertising wars fought by traditional insurers.
Evidence:
The partnership channel is a major growth driver. In Q2 2025, Root reported that its partnership channel (including embedded partners like Hyundai Capital America and Experian, and independent agents) nearly tripled new writings year-over-year (Source: Coverager, Aug 2025). This channel accounted for 44% of all new writings in the quarter. Root is also expanding access by joining comparative raters EZLynx and PL Rating (Source: Insurance Journal, Aug 7, 2025).
The Bear Case: Unsustainable DTC Costs and Competition
Bears argue that the direct channel remains prohibitively expensive and highly competitive, while the partnership channel trades marketing expense for reliance on partner strategies and scaling challenges.
Evidence:
The DTC Challenge: Competing in the direct market is difficult and expensive. Root appears sensitive to the competitive landscape. In Q2 2025, Root noted that "competition increased in our Direct channel and our data-science machine reacted exactly as designed, reducing marketing spend when compared to the first quarter of 2025." (Source: Root Q2 2025 Shareholder Letter, Page 4).
This sensitivity highlights the challenge of scaling the DTC channel profitably when acquisition costs rise.
Nascent Agent Channel: While growing, Root is still only in partnership with about 4% of independent agents, indicating a long runway before this channel reaches significant scale (Source: Insurance Journal, Aug 7, 2025). This could also be viewed as bullish, given the opportunity ahead.
Bull vs Bear: Financial Health and Profitability
After years of significant cash burn, Root has achieved GAAP profitability.
The Bull Case: A Validated, Scalable Business Model
Bulls argue that recent profitability validates the entire strategy. The combination of superior underwriting and efficient distribution is bearing fruit, suggesting the company can now self-fund its growth.
Evidence:
Root has sustained profitability for four consecutive quarters. In Q2 2025, Root reported a Net Income of $22 million, a $30 million improvement YoY. The Gross Combined Ratio was 94%, indicating strong underwriting profitability. Policies in Force (PIF) grew 12% YoY to 455,493 (Source: Root Q2 2025 Shareholder Letter, Page 2).
The Bear Case: Profitability During a Hard to Soft Market Transition
Bears caution that Root’s profitability coincides with a "hard market" in auto insurance, where carriers across the industry have significantly raised rates. Root’s success may be more attributable to these industry-wide rate hikes than a unique technological advantage.
Evidence:
Industry Trends: The entire auto insurance sector is seeing improved profitability as aggressive rate increases caught up with inflation. Auto insurance rates rose 20.6% year-over-year in early 2024, the sharpest annual increase since the 1970s (Source: IRMI, 2024 Review/2025 Developments).
The Coming Soft Market: Analysts predict this profitability will lead to increased competition. S&P Global Market Intelligence noted, "Over the longer term, we expect competition to return with a vengeance in the private auto market as carriers gain comfort with the durability of improved underwriting results.” (Source: Carrier Management, Dec 2024). When the market softens, Root's margins may compress.
Future Expenses: Management signaled that near-term profitability might be pressured by investments. "We will continue to invest in the back half of 2025 in our business, technology, and growth, which will impact our near-term net income profitability." (Source: Root Q2 2025 Shareholder Letter, Page 7).
Root Basic Insights Overview
See the below charts to get a general idea of the progression of the business since reporting metrics were provided.
Root Top & Bottom Line Charts
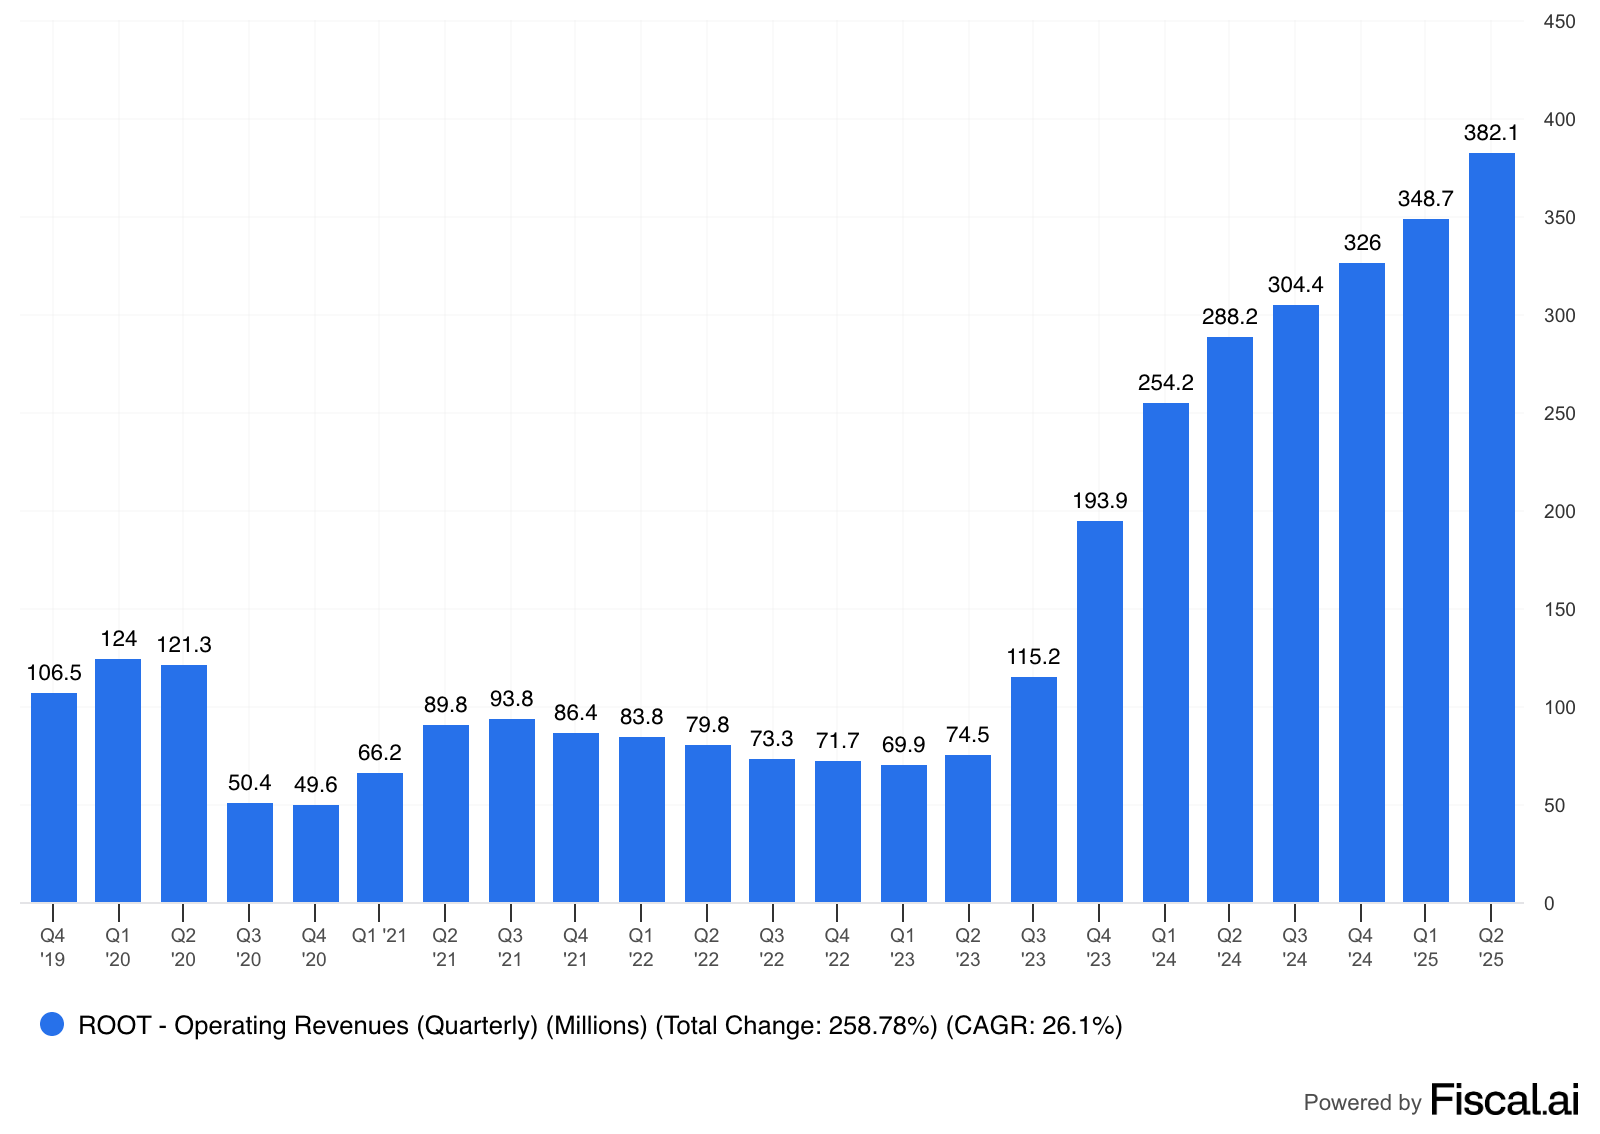
Root’s Revenue - Revenue sharply increased during the transition from the hard insurance market to the soft market, and was primarily driven by new policy growth. For the past year, revenue has been steadily increasing, driven by policy growth, rate increases over time, and less reliance on reinsurance.

Root’s Gross Profit - As calculated by fiscal.ai. As we can see, this roughly follows Revenue growth and reached an inflection point in Q1’2023.

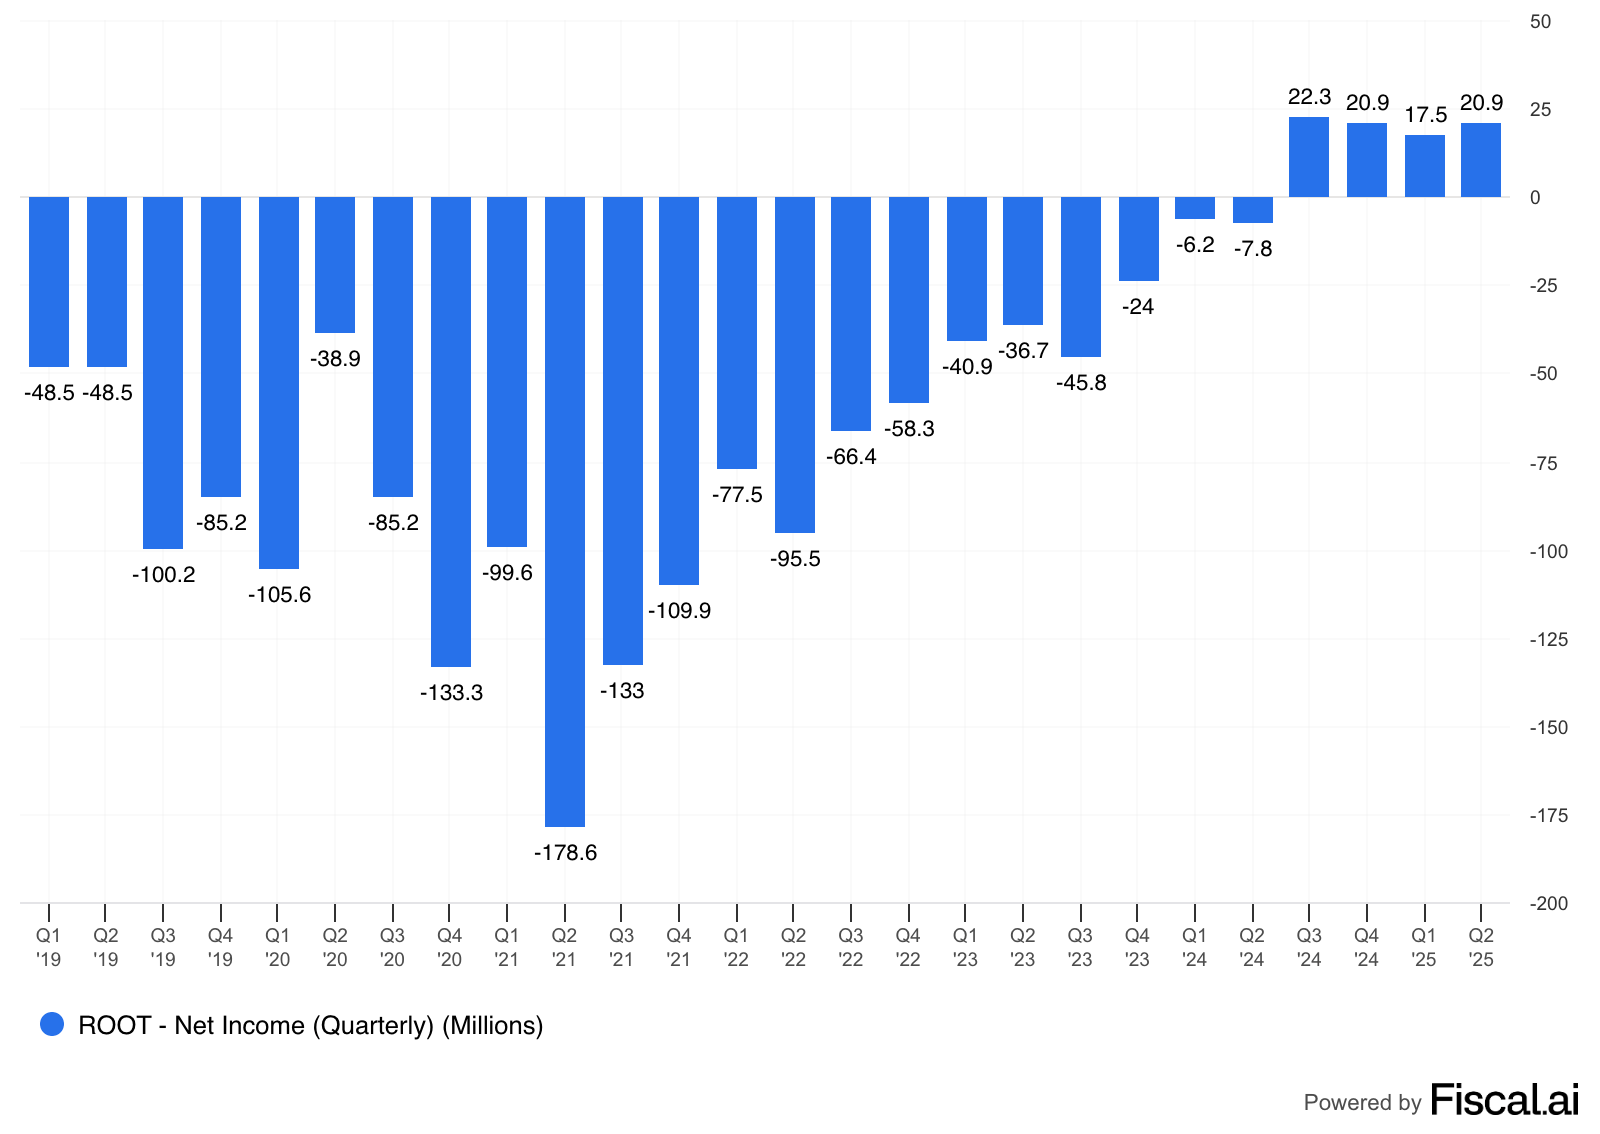
Root’s Net Income - Bottom line profitability flipped to positive in Q3’2024 and has remained positive since.

Root Key Performance Indicator Charts
Root’s Premiums in Force - This is the main top line metric for Root. It is the total annualized premium income expected.

Root’s Policies in Force - This is the total number of active policies.

Root‘s Premiums Per Policy - This is effectively the cost per policy for its duration. Because of inflation, this generally increases every year by some degree in aggregate.

Root’s Combined Ratio - This represents the percentage of premiums an insurer spends on claims and operating expenses. A lower net combined ratio indicates better underwriting profitability, with a ratio below 100% generally considered profitable.

Root’s Gross Loss Ratio - The gross loss ratio is a key metric in the insurance industry, representing the proportion of losses (including claims paid and loss adjustment expenses) to earned premiums. It shows how much an insurer spends on claims for every dollar of premium collected. A lower gross loss ratio means more profitability, all else being equal. Root has an industry leading GLR, which has consistently been trending down.

Root’s Loss Adjustment Expense Ratio - The loss adjustment expense (LAE) is the cost that insurance companies incur when investigating and settling an insurance claim. The LAE % shows the cost of these expenses relative to Gross Earned Premiums. A lower % means higher efficiency. Root’s LAE has been consistently trending down, showcasing strong efficiency.

Root’s Net Loss & LAE vs Progressive - This gives you a good look at how Root does vs the premier competition in efficiency (including LAE and rate adequacy). Root’s LAE is particularly impressive given how small the business is vs competitors (lack of economies of scale generally mean less efficiency).

Notable Charts to Watch
Root’s Investments & Cash Equivalents - This is funding that could be used to fund growth and serve as a risk based capital buffer. Root has a healthy amount of cash & equivalents given their current profitability.

Root’s Total Debt - This is debt that Root will eventually have to repay or continue paying interest on. As we see, Root has significantly more cash & investments than debt.

As we see from the above charts, Root has shown strong increases to both top line and bottom line growth, with metrics overall moving in the right direction.
There was a period where policies in force struggled during 2021-22, primarily because of inflation related costs driving non-renewals.
Root Advanced Insights - What is Driving Everything?
The financial charts above tell a compelling story of a company on the rebound. The turnaround to profitability is clear, and key metrics are heading in the right direction.
But these charts raise a more important question than they answer: Is this success built to last, or was it a temporary gift from an unusually favorable hard to soft market transition?
To find the answer, we have to move beyond the surface-level data and into the core operational drivers.
Below, we dissect the metrics that truly matter: operating leverage, marketing efficiency, the partnership growth breakdown (including Carvana vs. non-Carvana), customer churn, valuation, and the key points deciding whether it is a business worth owning.

Subscribe to our premium content to read the rest.
Join a select group of investors who get my personal portfolio updates, deep-dive stock analysis, and exclusive access to the financial toolkit I use to navigate the market.
Already a paying subscriber? Sign In.
Reply